Grades
Ilmiya’s Grades system offers a structured overview of each student’s academic progress, ranking, and lesson-by-lesson mastery — allowing educators to track performance across lessons and activities.
Student Data Overview
Section titled “Student Data Overview”The grades list displays key metrics at a glance:
- Student name
- Lessons completed
- Accuracy
- Questions answered
- Points earned
Controls available on this list
Section titled “Controls available on this list”- Search — find a student by name
- Class filter — narrow the list to a specific class
- Date range filter — scope every number on the list to a specific time window
- Archived students toggle — switch between active and archived students
- Sortable columns — click any column header to sort ascending/descending
- Export as image — download the current table view as an image file
- Manual refresh — recalculate the numbers on demand
- Color-coded ranking — each metric column (Lessons, Accuracy, Questions, Points) is shaded relative to the student’s standing among their classmates, so top and bottom performers are visible at a glance
Detailed Student Profile
Section titled “Detailed Student Profile”Overview Tab
Section titled “Overview Tab”Clicking a student’s name opens their full lesson history: three summary cards at the top (Lessons Completed, Accuracy, Questions Answered) followed by a single table listing every lesson, with each row showing:
| Column | What It Shows |
|---|---|
| Mastery | Skill tier reached for that lesson (Beginner → Expert) |
| Accuracy | Correct vs. incorrect answer ratio |
| Attempts | How many times the student has attempted that lesson |
| Time Spent | Time spent on that lesson |
| Trophy | Trophy tier earned, tied to mastery |

Controls available on this page:
- Lesson search — filter the table by lesson name
- Status filter — show only Completed or only In Progress lessons
- Date range filter — scoped to this student’s lesson table
- Sortable columns — Lesson, Date, Time Spent, Attempts, Accuracy, Trophy
- Print and export as image
- Manual refresh
How Accuracy and Mastery Are Calculated
Section titled “How Accuracy and Mastery Are Calculated”Accuracy is correct answers divided by total questions in the quiz, recalculated every time a student submits or updates an attempt. Mastery is the word that accuracy earns — the closest thing today’s app has to a grade:
| Accuracy | Mastery |
|---|---|
| 100% | Expert |
| ≥ 85% | Proficient |
| ≥ 70% | Competent |
| Below 70% | Beginner |
Lesson Status
Section titled “Lesson Status”Each lesson also carries a status:
| Status | When it applies |
|---|---|
| Completed | Lesson/quiz is marked done |
| In Progress | Not done, but at least one question answered |
| Not Started | Not done, nothing answered yet |
Attempts & Retakes
Section titled “Attempts & Retakes”If a student attempts the same lesson — or the same component within it — more than once, each attempt creates a new quiz-result record rather than overwriting the previous one. The attempt count shown for a lesson increases by one with every retry, and the accuracy/mastery displayed reflect whichever attempt is being viewed.
Lesson-Specific Insights
Section titled “Lesson-Specific Insights”Drill into any lesson from a student’s profile to see:
- Full attempt history for that lesson, with sortable columns (Attempt, Date, Time Spent, Question, Correct, Incorrect)
- Per-attempt question preview (see below)
- Export and print, same as elsewhere in Grades
Per-Lesson Leaderboard
Section titled “Per-Lesson Leaderboard”From this same drill-down view, a Rank toggle switches the page from “this student’s attempts” into a full leaderboard for that specific lesson — a top-3 podium plus a searchable, ranked table showing every student’s points and time spent on that exact lesson.
Question Preview
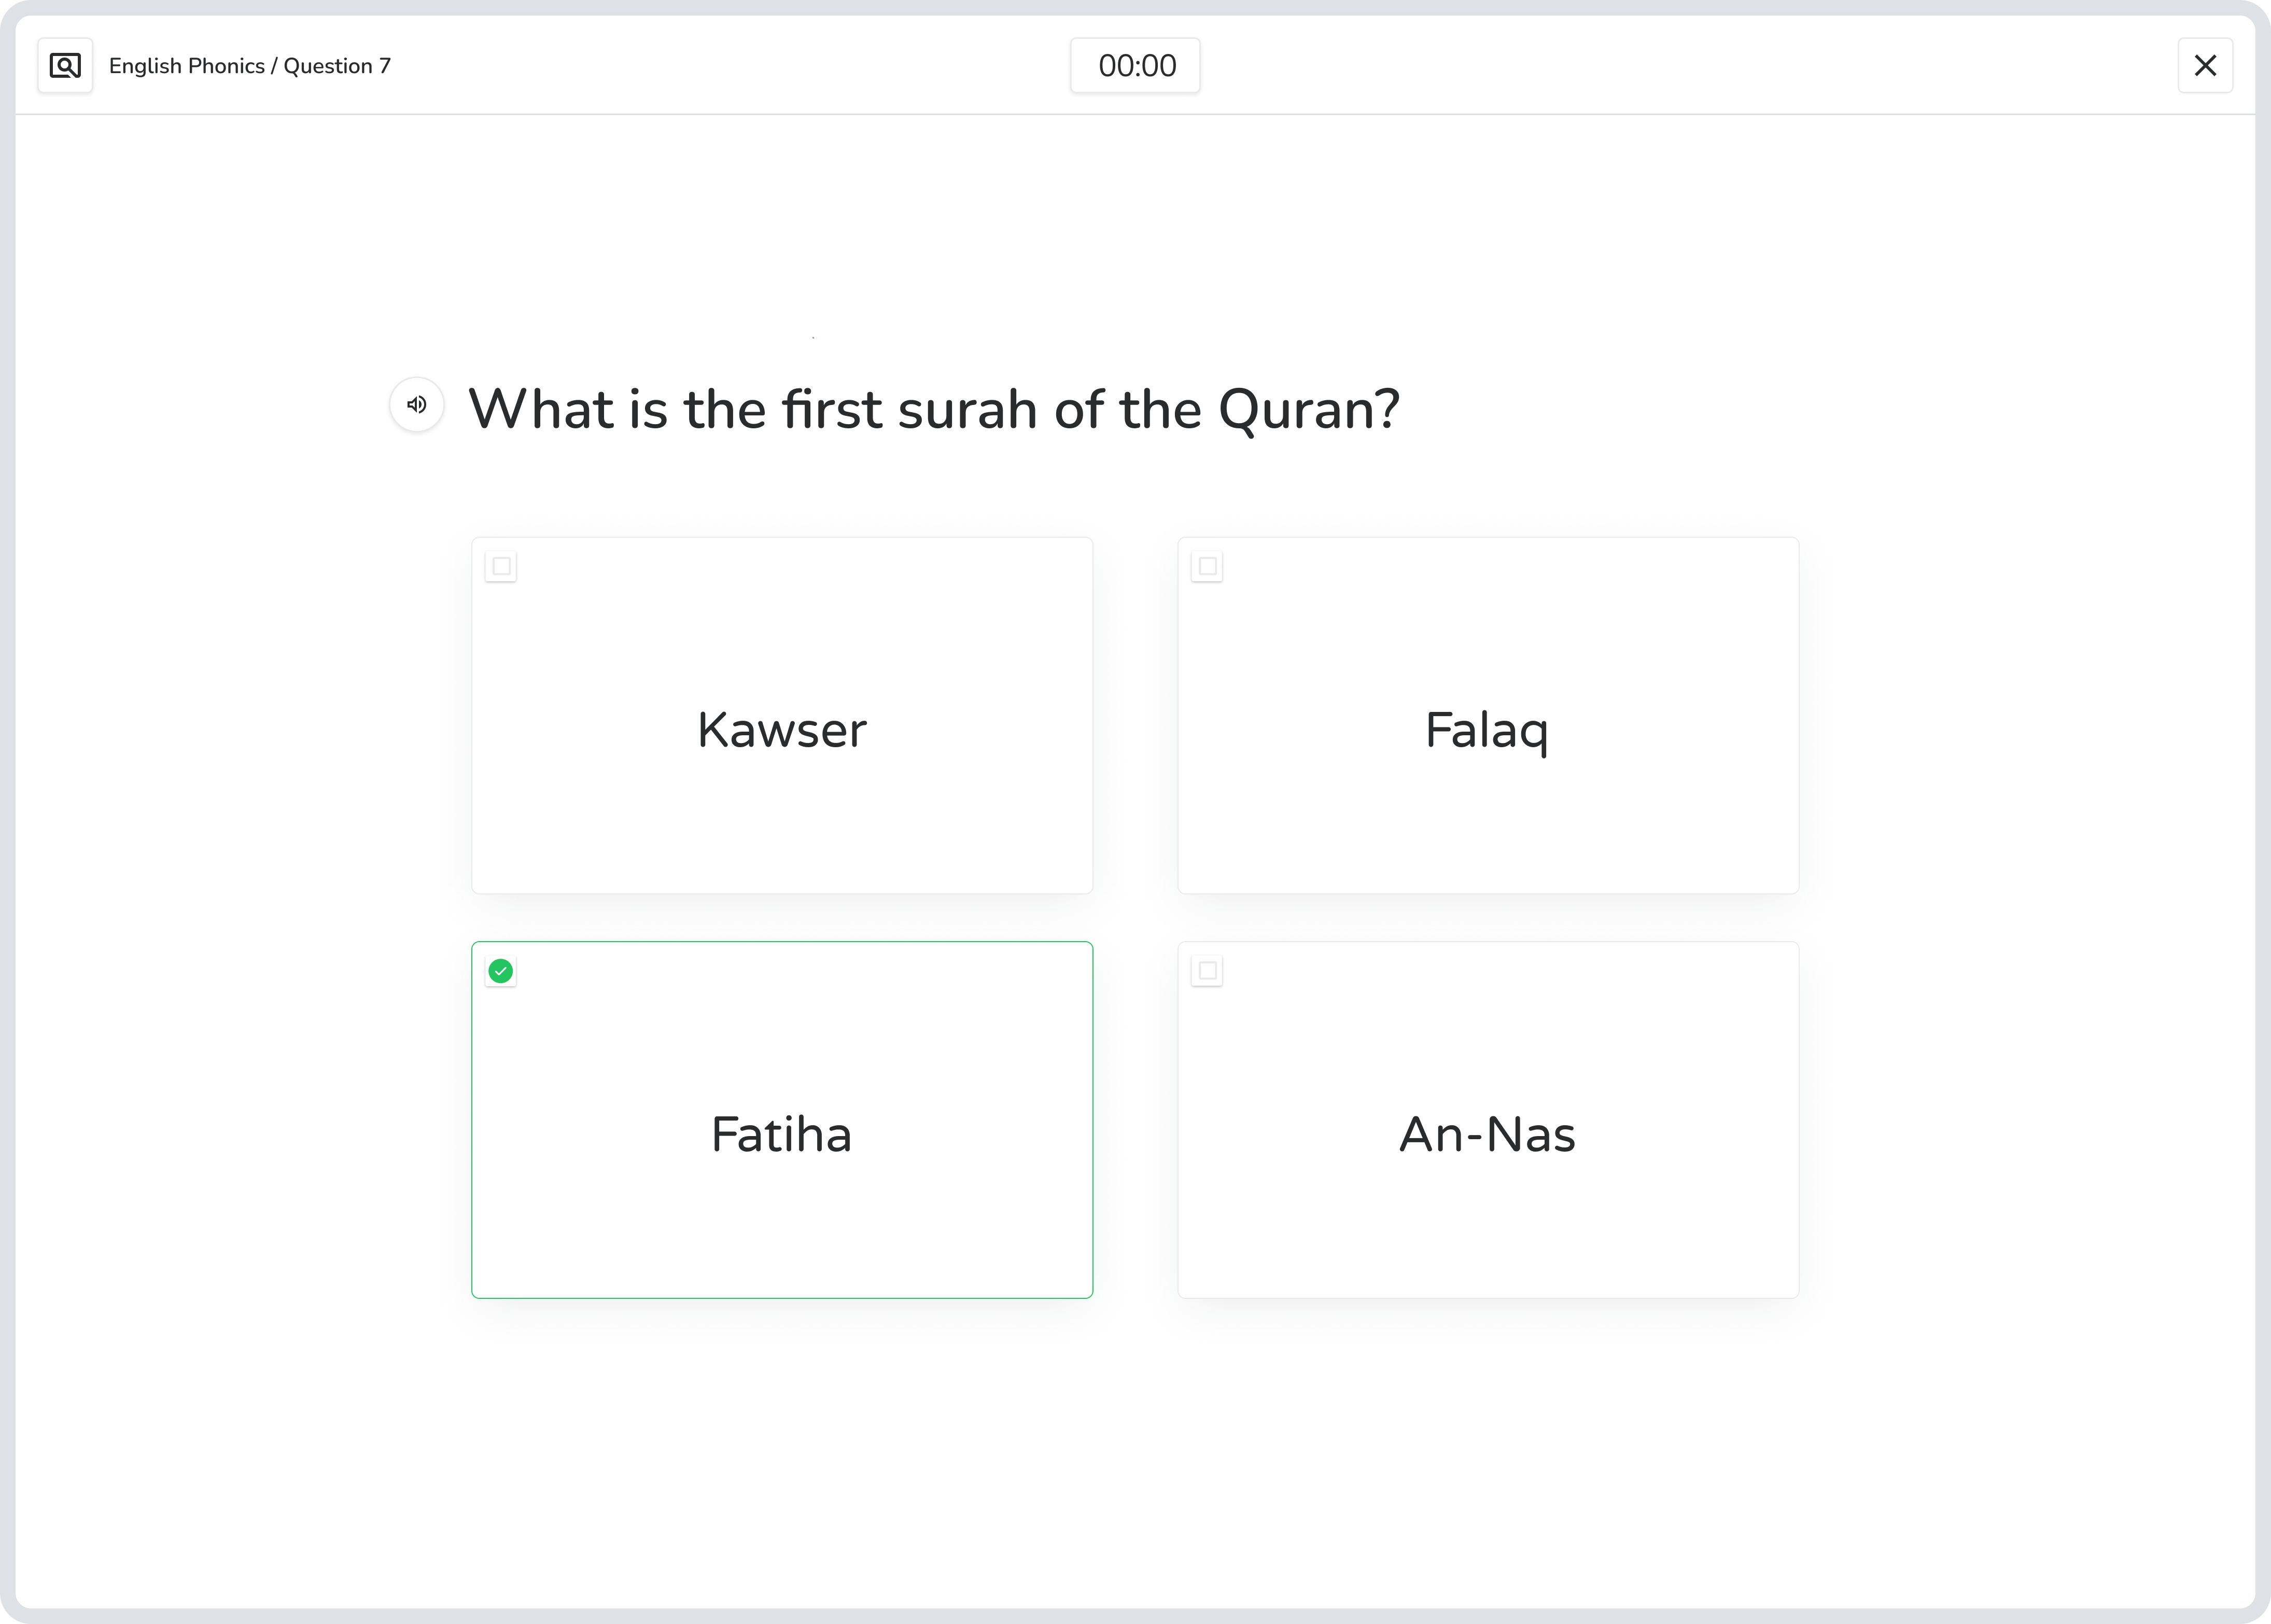
Section titled “Question Preview”Clicking into a lesson’s question-by-question breakdown opens a Question Preview:
- A table lists every question in that attempt — question, time spent, points earned, correct or not.
- Click a question row to preview it — the question’s actual content loads alongside the student’s submitted answer.
- It renders using the same component the student saw live (multiple choice, drag-and-drop, fill in the blank, video, audio, and more) — just populated with their answer, in read-only mode.
Benefits
Section titled “Benefits”- Helps students identify strengths and weaknesses with concrete data
- Supports targeted improvement and more efficient study habits
- Encourages engagement and motivation through visible progress tracking
The Grades system consolidates lesson-by-lesson performance and mastery tracking into a single interface — making it easier for educators and students to monitor and improve learning outcomes.